

- The Official Formula
- Breaking Down the Formula: Numerator vs Denominator
- What Counts as a “Citable Item”? (The Critical Distinction)
- Included in the Denominator (Citable Items)
- Excluded from the Denominator (But Citations Still Count in Numerator)
- Why This Asymmetry Matters
- Step-by-Step Calculation: Three Worked Examples
- Example 1: A Mid-Tier Biomedical Journal
- Example 2: A Mathematics Journal
- Example 3: A High-Volume Clinical Journal
- What Years of Citations Are Used in Impact Factor?
- The Three-Year Window
- Practical Example: The 2024 JIF
- Why Only Two Years?
- Who Calculates Journal Impact Factor — and How?
- Clarivate Analytics: The Sole Authority
- The Calculation Process
- Suppression of Impact Factors
- The 2-Year vs 5-Year Impact Factor: Formula Comparison
- When to Use Which
- Other Related JCR Metrics Explained
- Immediacy Index
- Cited Half-Life
- Journal Citation Indicator (JCI)
- Eigenfactor Score
- Article Influence Score (AIS)
- The Numerator–Denominator Asymmetry (Why IF Can Be Inflated)
- The Core Problem
- Known Gaming Strategies That Exploit This
- Clarivate’s Response
- Common Calculation Mistakes Researchers Make
- Mistake 1: Confusing Publication Year and JIF Year
- Mistake 2: Counting All Document Types in the Denominator
- Mistake 3: Quoting the Release Year as the JIF Year
- Mistake 4: Using JIF to Compare Journals Across Fields
- Mistake 5: Trusting Unofficial Impact Factors
- How to Verify a Journal’s Impact Factor
- Step 1: Confirm Web of Science Indexing (Free)
- Step 2: Look Up the Official JIF (Institutional Access)
- Step 3: Check the Journal’s Own Website
- Step 4: Free Alternative — SCImago (scimago.org)
- Step 5: Cross-Check Multiple Sources
- Frequently Asked Questions
- How exactly is journal impact factor calculated?
- What years of citations are used in the impact factor calculation?
- Who calculates and publishes the journal impact factor?
- What is a citable item in the impact factor formula?
- Can I calculate impact factor myself?
- Why is my journal’s impact factor different each year?
- Does my own self-citation count toward my journal’s impact factor?
- What happens if a journal is caught gaming its impact factor?
- Is the impact factor the same as CiteScore?
- Conclusion
Quick answer: Journal impact factor is calculated by dividing the total number of citations received in the current year to articles published in the two preceding years, by the total number of citable articles published in those same two years. Only original research articles and review articles count in the denominator. Clarivate Analytics performs this calculation once per year and publishes results in June through the Journal Citation Reports.
If you want to understand every component of that formula — what counts, what does not count, which years are used, who calculates it, and how to verify it — this guide covers all of it, with three worked examples.
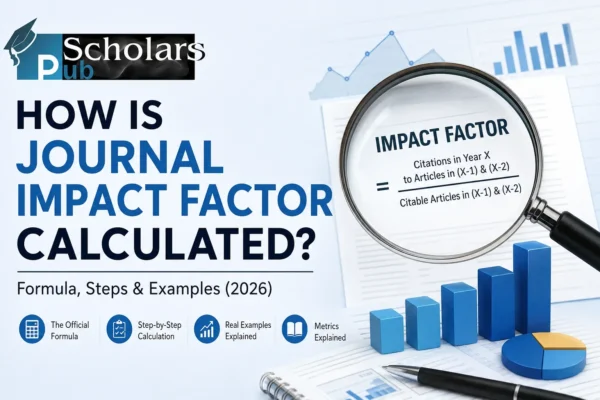
The Official Formula
The Journal Impact Factor formula, as defined by Clarivate Analytics, is:
JIF (Year X) = Total citations in Year X to articles published in Years X−1 and X−2 ÷ Total citable articles published in Years X−1 and X−2
For the 2024 impact factor (published in June 2025):
JIF 2024 = Citations received in 2024 to articles published in 2022 and 2023 ÷ Citable articles published in 2022 and 2023
That is the complete formula. Everything else in this article is about understanding exactly what each part of it means — because the details matter enormously for interpreting, comparing, and trusting any JIF number you encounter.
Breaking Down the Formula: Numerator vs Denominator
| Component | What it counts | What it excludes |
|---|---|---|
| Numerator (citations) | All citations in Year X from Web of Science indexed journals to ANY content published by the journal in Years X−1 and X−2 | Citations from non-indexed sources; citations to articles published before X−2 |
| Denominator (citable items) | Original research articles + review articles published in Years X−1 and X−2 | Editorials, letters, news items, corrections, errata, meeting abstracts |
The most important thing to understand about this formula is that the numerator and denominator do not use the same document types. This asymmetry — citations to all content in the numerator, but only select content in the denominator — is one of the most criticised and misunderstood aspects of JIF calculation.
What Counts as a “Citable Item”? (The Critical Distinction)
Clarivate’s definition of “citable items” determines the denominator, and it is narrower than most researchers assume.
Included in the Denominator (Citable Items)
| Document Type | Counted? | Notes |
|---|---|---|
| Original research articles | ✅ Yes | The core of most journals |
| Review articles | ✅ Yes | Full systematic and narrative reviews |
| Proceedings papers (some) | ✅ Sometimes | Only when indexed as such in WoS |
Excluded from the Denominator (But Citations Still Count in Numerator)
| Document Type | In Denominator? | Citations Count in Numerator? |
|---|---|---|
| Editorials | ❌ No | ✅ Yes |
| Letters to the editor | ❌ No | ✅ Yes |
| News items | ❌ No | ✅ Yes |
| Corrections / Errata | ❌ No | ✅ Yes |
| Meeting abstracts | ❌ No | ✅ Yes (if cited) |
| Book reviews | ❌ No | ✅ Yes (if cited) |
Why This Asymmetry Matters
If a journal publishes a widely cited editorial — say, a consensus statement or a provocative commentary that attracts hundreds of citations — those citations flow into the numerator but the editorial does not appear in the denominator. The result: the impact factor rises without the journal having published more research articles.
This is not hypothetical. In 2007, the journal Folia Phoniatrica et Logopaedica published an editorial that cited all of its own recent articles as a protest, causing its IF to jump from 0.66 to 1.44. Clarivate subsequently suppressed its IF for two years. The asymmetry is real and consequential.
Step-by-Step Calculation: Three Worked Examples
Example 1: A Mid-Tier Biomedical Journal
Scenario: Calculate the 2024 impact factor for a hypothetical Journal of Applied Physiology Research.
Step 1 — Define the time windows – Citation year (numerator year): 2024 – Publication years counted: 2022 and 2023
Step 2 — Count citable articles published (denominator) – Research articles published in 2022: 95 – Review articles published in 2022: 15 – Research articles published in 2023: 105 – Review articles published in 2023: 20 – Total denominator: 95 + 15 + 105 + 20 = 235
Step 3 — Count citations received in 2024 (numerator) – Citations in 2024 to 2022 articles: 620 – Citations in 2024 to 2023 articles: 750 – Total numerator: 620 + 750 = 1,370
Step 4 — Apply the formula – 2024 JIF = 1,370 ÷ 235 = 5.83
Interpretation: This journal’s articles published in 2022 and 2023 were cited an average of 5.83 times each during 2024 — a solid result placing it in Q1 for many biomedical sub-disciplines.
Example 2: A Mathematics Journal
Scenario: Calculate the 2024 impact factor for a hypothetical International Journal of Pure Mathematics.
Step 1 — Define the time windows – Citation year: 2024 – Publication years: 2022 and 2023
Step 2 — Count citable articles (denominator) – Research articles in 2022: 48 – Review articles in 2022: 4 – Research articles in 2023: 52 – Review articles in 2023: 6 – Total denominator: 110
Step 3 — Count citations in 2024 (numerator) – Citations in 2024 to 2022 articles: 88 – Citations in 2024 to 2023 articles: 102 – Total numerator: 190
Step 4 — Apply the formula – 2024 JIF = 190 ÷ 110 = 1.73
Interpretation: An IF of 1.73 in pure mathematics represents a highly respected, Q1-level journal. The low absolute number reflects the field’s citation culture — smaller communities, longer citation cycles, and shorter reference lists — not the journal’s quality.This is why field-specific benchmarks matter: our detailed breakdown of what a good impact factor looks like across disciplines shows exactly where 1.73 sits relative to all mathematics journals.
Example 3: A High-Volume Clinical Journal
Scenario: Calculate the 2024 impact factor for a hypothetical Clinical Medicine International.
Step 1 — Define the time windows – Citation year: 2024 – Publication years: 2022 and 2023
Step 2 — Count citable articles (denominator) – Research articles 2022–2023: 820 – Review articles 2022–2023: 180 – Total denominator: 1,000
Step 3 — Count citations in 2024 (numerator) – Total citations from 2024 to 2022–2023 articles: 6,500 – Note: Also includes 340 citations to editorials and letters (these count in numerator, not denominator) – Total numerator: 6,500 + 340 = 6,840
Step 4 — Apply the formula – 2024 JIF = 6,840 ÷ 1,000 = 6.84
Interpretation: The editorial citations add 0.34 to the IF. In a high-volume journal, this numerator/denominator asymmetry is a meaningful and often overlooked inflation factor.
What Years of Citations Are Used in Impact Factor?
This is one of the most commonly misunderstood aspects of the JIF, and the source of a very common error when researchers try to look up or quote their journal’s IF.
The Three-Year Window
The JIF calculation always spans three consecutive years:
- Year 1 and Year 2: The publication years — when the articles being cited were published
- Year 3 (the JIF year): The citation year — when the citations are being counted
Practical Example: The 2024 JIF
| Timeline element | Year |
|---|---|
| Articles published (counted in denominator) | 2022 and 2023 |
| Citations counted (numerator) | 2024 |
| JIF calculated for | 2024 |
| JIF published by Clarivate | June 2025 |
This is where researchers often get confused: the 2024 JIF is published in 2025. When the JCR is released in June 2025, it contains impact factors labelled “2024” — meaning they measure 2024 citation activity. The articles being cited were published in 2022 and 2023.
Why Only Two Years?
Eugene Garfield chose a two-year publication window because, for most scientific fields in the 1960s, the majority of citations to an article occurred within 24 months of publication. For fast-moving fields like molecular biology and clinical medicine, this remains broadly true.
For slower fields — mathematics, geology, humanities, social sciences — this assumption breaks down badly. Important work in these disciplines may take 5–10 years to accumulate most of its citations. This is the primary reason why a 5-year impact factor exists and is more meaningful for those disciplines.For a broader look at how the impact factor metric works — including its history and alternatives — our complete journal impact factor guide covers these foundations in detail.
Who Calculates Journal Impact Factor — and How?
Clarivate Analytics: The Sole Authority
The Journal Impact Factor is calculated exclusively by Clarivate Analytics and published through the Journal Citation Reports (JCR). No other organisation produces a JIF that has official status.
Important: Any impact factor claimed by a journal that is not indexed in the Web of Science Core Collection is NOT an official JIF. Predatory journals frequently display fabricated or unofficial “impact factors” from illegitimate services. The only way to verify a legitimate JIF is to confirm the journal appears in the Web of Science Master Journal List at mjl.clarivate.com.
The Calculation Process
Here is what Clarivate does to produce the JIF each year:
1. Data extraction (throughout the year) Clarivate extracts citation data from the Web of Science Core Collection — a curated database of approximately 22,000+ journals across the Science Citation Index Expanded (SCIE), Social Sciences Citation Index (SSCI), Arts & Humanities Citation Index (AHCI), and Emerging Sources Citation Index (ESCI).
2. Article classification Every item published by each indexed journal is classified by document type. This classification determines whether an item enters the denominator as a “citable item” or is excluded.
3. Citation matching Every citation made by every indexed article in the citation year is matched back to the article it cites. This matching process must resolve ambiguities in journal names, article titles, author names, and volume/page numbers — a massive data quality challenge across millions of references.
4. Self-citation monitoring Clarivate tracks the proportion of a journal’s IF that comes from self-citations (citations from the journal to its own recent articles). Journals with anomalously high self-citation rates are investigated and may have their IFs suppressed.
5. Annual JCR publication Results are compiled and published once per year, typically in June, in the Journal Citation Reports. Access requires an institutional subscription (most universities provide this).
Suppression of Impact Factors
Clarivate can and does suppress a journal’s JIF when citation manipulation is detected. A suppressed journal remains indexed in Web of Science but shows no impact factor in the JCR for that year. This is a significant public signal of editorial integrity concerns.
The 2-Year vs 5-Year Impact Factor: Formula Comparison
Both metrics use the same basic structure — citations divided by citable articles — but with different time windows.
| Feature | 2-Year JIF | 5-Year JIF |
|---|---|---|
| Formula | Citations in Year X to Y-1 and Y-2 articles ÷ Citable articles in Y-1 and Y-2 | Citations in Year X to Y-1 through Y-5 articles ÷ Citable articles in Y-1 through Y-5 |
| Citation window | 2 years | 5 years |
| Publication window | 2 years | 5 years |
| Year-to-year volatility | Higher — a single highly cited paper creates a larger impact | Lower — diluted across a larger article pool |
| Best for | Fast-citation fields (biomedicine, genetics, clinical medicine) | Slow-citation fields (mathematics, social sciences, ecology) |
| Standard use | Most widely quoted and recognised | Supplementary; less commonly cited in evaluations |
When to Use Which
Always check both if you are evaluating a journal in a slow-citation field. A mathematics journal with a 2-year IF of 1.5 and a 5-year IF of 2.8 tells a very different story from the 2-year number alone. The 5-year figure captures citations that the 2-year window misses because the field’s articles take longer to be read and cited.
Other Related JCR Metrics Explained
The JCR publishes several additional metrics alongside the standard JIF. Understanding what each calculates helps you use the right one for your purpose.
Immediacy Index
Formula: Citations in Year X to articles published in Year X ÷ Citable articles published in Year X
Measures how quickly articles are cited in the same year they are published. High immediacy index = field moves fast, papers get cited almost immediately (common in high-traffic clinical journals). Low immediacy index = slower adoption cycles.
Cited Half-Life
Not a citations-per-article ratio — instead, it measures the median age of the articles being cited from a journal in a given year. A cited half-life of 7 years means that half of all citations to the journal in that year were to articles published within the past 7 years. Longer half-lives indicate durable relevance; shorter half-lives indicate rapid obsolescence.
Journal Citation Indicator (JCI)
Introduced by Clarivate as a field-normalised version of the JIF. It adjusts for differences in citation behaviour between disciplines, making cross-field comparison more meaningful. A JCI of 1.0 means the journal performs exactly at the average for its field; above 1.0 is above average.
Eigenfactor Score
Uses a network-based algorithm (similar to Google PageRank) applied to the entire citation graph of all Web of Science journals. Citations from prestigious, highly-cited journals contribute more than citations from less-cited journals. Excludes self-citations. Measures total journal influence rather than per-article average.
Article Influence Score (AIS)
The Eigenfactor Score normalised by the fraction of articles the journal published in the full dataset. Average AIS = 1.0. Above 1.0 means above-average per-article influence in the citation network. More comparable across journals of different sizes than the raw Eigenfactor Score.
The Numerator–Denominator Asymmetry (Why IF Can Be Inflated)
This is the most technically important — and most commonly overlooked — aspect of JIF methodology. Understanding it explains how impact factors can be legitimately inflated and why some numbers should be treated with scepticism.
The Core Problem
The numerator counts citations to all content published by the journal (articles, reviews, editorials, letters, news items — everything). The denominator counts only citable items (articles and reviews). This means:
- A journal that publishes a heavily cited editorial: citations go into the numerator, but the editorial is absent from the denominator → IF rises
- A journal that publishes many uncited editorials: these don’t reduce the denominator, and if uncited, they don’t add to the numerator either → no effect on IF
- A journal that switches from publishing many editorials (non-citable) to fewer (same total citations): IF appears to rise as denominator shrinks
Known Gaming Strategies That Exploit This
Coercive self-citation: An editor instructs submitting authors to add citations to the journal’s recent articles before acceptance. These citations flow into the numerator. A 2012 survey found that 1 in 5 researchers in economics, sociology, psychology, and business disciplines had experienced this practice.
Citation stacking: A coordinated group of journals agrees to cite each other’s recent articles in every paper they publish. Each journal’s numerator rises, inflating all their IFs. Clarivate detected and suppressed this practice in a high-profile case in 2012 involving 57 journals.
Review article strategy: Journals that publish more reviews structurally have higher IFs. Reviews summarise entire bodies of literature and attract citations from researchers who have not read every underlying paper. A journal can shift its publication mix toward reviews to improve its IF without any increase in underlying research quality.
Clarivate’s Response
Clarivate monitors several signals: journal self-citation rate, patterns of citation exchange between journals, and anomalous year-on-year IF jumps. When manipulation is confirmed, it suppresses the journal’s IF entirely in the JCR. This is published transparently — journals whose IFs are suppressed are identifiable in the JCR.
Common Calculation Mistakes Researchers Make
Mistake 1: Confusing Publication Year and JIF Year
Wrong: “My paper was published in 2024, so it counts toward the 2024 impact factor.”
Right: A paper published in 2024 contributes to the denominator of the 2025 and 2026 impact factors (for the 2-year window). Citations to it in 2026 will contribute to the 2026 JIF.
Mistake 2: Counting All Document Types in the Denominator
Wrong: “The journal published 300 items in 2022–2023, so the denominator is 300.”
Right: Only research articles and reviews count. If 60 of those 300 items were editorials, letters, and news items, the denominator is 240.
Mistake 3: Quoting the Release Year as the JIF Year
Wrong: “This journal’s 2025 impact factor is 8.4” (when you got the figure from the JCR released in June 2025).
Right: The JCR released in June 2025 contains the 2024 impact factors. “2025” refers to when Clarivate published the data, not the year the citations were counted.
Mistake 4: Using JIF to Compare Journals Across Fields
Wrong: “Journal A in molecular biology has IF 5.0, and Journal B in mathematics has IF 1.8, so Journal A is better.”
Right: These numbers are not comparable across disciplines. Journal B in mathematics may be Q1; Journal A in molecular biology may be Q3. Always compare within the same JCR subject category.
Mistake 5: Trusting Unofficial Impact Factors
Wrong: Submitting to a journal because it displays an “Impact Factor: 3.2” on its homepage, without verifying the source.
Right: Check the journal in the Web of Science Master Journal List (mjl.clarivate.com). If it’s not there, the claimed IF is not an official Clarivate JIF.
How to Verify a Journal’s Impact Factor
Step 1: Confirm Web of Science Indexing (Free)
Go to mjl.clarivate.com → search by journal name or ISSN → confirm the journal is indexed in SCIE, SSCI, AHCI, or ESCI. If it is not listed, it has no official JIF.
Step 2: Look Up the Official JIF (Institutional Access)
Log in to the Journal Citation Reports via your institution’s library (most universities subscribe). Search the journal name → view the current and historical JIF, 5-year IF, JCI, quartile ranking, and citation distribution.
Step 3: Check the Journal’s Own Website
Most JCR-indexed journals display their current official JIF in the “About the Journal” or “For Authors” section. This is usually accurate but always cross-reference with Step 2 when precision matters.
Step 4: Free Alternative — SCImago (scimago.org)
SCImago uses Scopus data to publish SJR (SCImago Journal Rank) and quartile rankings for ~27,000 journals — free, no subscription needed. SJR is not the same as JIF but provides a useful free proxy with broader journal coverage. Good for quick checks and journal shortlisting.
Step 5: Cross-Check Multiple Sources
A journal with consistent high standing across JIF (JCR), CiteScore (Scopus), and SJR (SCImago) has genuinely strong metrics. Significant divergence between these three is a signal worth investigating.
Frequently Asked Questions
How exactly is journal impact factor calculated?
JIF = Total citations received in the current year to articles published in the two preceding years ÷ Total citable articles (original research + reviews) published in those two years. For the 2024 JIF: citations received in 2024 to 2022–2023 articles ÷ citable articles published in 2022–2023. Clarivate Analytics performs this calculation using Web of Science data and publishes results annually in June.
What years of citations are used in the impact factor calculation?
For any given JIF year (e.g., 2024), citations are counted from that single year (2024) to articles published in the two preceding years (2022 and 2023). The JIF is always based on a three-year span: two publication years + one citation year.
Who calculates and publishes the journal impact factor?
Clarivate Analytics is the sole authority that calculates and publishes the official Journal Impact Factor through the Journal Citation Reports (JCR), released annually in June. Only journals indexed in the Web of Science Core Collection receive an official JIF. Any impact factor from any other source is unofficial.
What is a citable item in the impact factor formula?
A citable item is any document classified by Clarivate as an original research article or review article. Editorials, letters to the editor, corrections, news items, and meeting abstracts are NOT citable items and are excluded from the denominator, even though citations to them still count in the numerator.
Can I calculate impact factor myself?
You can apply the formula yourself, but you cannot independently verify Clarivate’s official JIF because the full citation count data used in the numerator comes from the proprietary JCR database — not the publicly searchable version of Web of Science. You can calculate an approximate figure using Web of Science searches, but it will not exactly match the published JIF due to differences in database snapshots and document type classification.
Why is my journal’s impact factor different each year?
JIF fluctuates annually because both the number of citations and the number of citable articles change year to year. A single highly cited paper published in the window year can raise the IF meaningfully. Changes in publication volume, article mix (more reviews vs. more research articles), self-citation patterns, and field-wide citation trends all contribute to year-to-year variation.
Does my own self-citation count toward my journal’s impact factor?
Yes — if you cite your own previously published paper in your new paper (self-citation as an author), and both papers are in the same journal, that citation contributes to the journal’s IF numerator. However, journal-level self-citation (the journal citing its own recent articles) is monitored by Clarivate and can trigger suppression if the rate is anomalously high.
What happens if a journal is caught gaming its impact factor?
Clarivate can suppress the journal’s JIF entirely in the JCR for that year. The journal remains indexed in Web of Science but shows no impact factor. This is a public signal with serious consequences for the journal’s reputation and its ability to attract high-quality submissions.
Is the impact factor the same as CiteScore?
No. CiteScore is published by Elsevier using Scopus data. Key differences: CiteScore uses a 4-year citation window (vs 2 years for JIF), includes all document types in both numerator and denominator (vs the asymmetric JIF approach), covers ~27,000 journals (vs ~22,000 for JCR), and is free to access. CiteScore values are typically higher than JIF for most journals because of the 4-year window and broader document type inclusion.
Conclusion
The journal impact factor formula is mathematically simple — a ratio of citations to citable articles over a defined time window — but the details embedded in it are consequential. The distinction between what counts in the numerator versus the denominator explains why impact factors can be inflated. The two-year publication window explains why certain fields are systematically disadvantaged. The annual release cycle explains why the JIF year and the JCR release year are always one year apart.
Understanding the calculation behind the number transforms the JIF from a black-box metric into a transparent, interpretable tool. You can read any journal’s IF with clarity, spot manipulation signals, make better submission decisions, and present your publication record to committees and funders with confidence.
The metric has limitations — significant ones. But those limitations are far easier to navigate when you understand precisely how the number was produced.
I am a seasoned professional with over 9 years of transformative experience in the domains of molecular biology, immunology, and clinical research. With a career that spans from 2006 to 2018, my journey has been marked by a relentless pursuit of scientific excellence and an unwavering commitment to improving healthcare outcomes through groundbreaking research. I have worked at one of India’s premier medical institutions, AIIMS(All India Institute of Medical Sciences), where I contributed significantly to the fields of molecular biology and clinical research. My expertise in protein analysis and genetic studies allowed me to identify potential biomarkers and improve diagnostic accuracy, contributing to better healthcare outcomes for patients. Notably, the research work has been published in prestigious scientific journals such as the Indian Journal of Ophthalmology and the British Journal of Ophthalmology.
Publication in these esteemed journals reflects my commitment to advancing medical science and sharing insights with the global research community. These publications highlight my expertise in areas ranging from gene polymorphism and immune response mechanisms to the effects of chronic drug therapy, all contributing to the larger body of scientific knowledge. My passion for scientific communication led me to pursue an Executive Diploma in Medical Writing from CliMed Research Solutions and Curio Training and Research Institute (CTRI), India. This certification has further refined my ability to bridge the gap between complex scientific research and its practical applications in healthcare. My passion for content writing drives me to continuously create content that derives engagement ,build trust, and leaves a lasting impression on readers”.

